Machine Learning · Time Series · Deep Learning
Stock Forecasting: LSTM vs ARIMA — Deep learning against classical baselines
A leakage-free comparison of an LSTM, ARIMA and a moving-average baseline on five years of five large-cap stocks — showing that the “best” model depends on the metric.
- Problem
- Forecasting demos often report impressive accuracy from leaky pipelines. The honest question is narrower: does a deep model add anything over classical baselines when evaluation is strictly out-of-sample?
- Approach
- Built 15 technical indicators, split strictly by time (2020–2023 train, 2024 test), and compared a 7-day moving average, auto-ARIMA and a dual-head PyTorch LSTM on price error and directional accuracy.
Key results
- LSTM directional accuracy · vs 45.8% ARIMA
- 55.5%
- ARIMA MAPE — lowest price error
- 1.50%
- LSTM parameters, trained in 3.4 s on a T4
- 126K
01
Overview
A forecasting study on real market data for Tesla, Apple, Amazon, Google and Microsoft (2020–2024, via the Yahoo Finance API), comparing a deep sequence model against classical baselines under a strictly temporal evaluation.
02
Problem & motivation
Most stock-prediction notebooks leak the future into training and report numbers nobody could trade on. This project does the boring part properly — and then asks which model actually wins, on which metric.
03
My role
- Independent project — data pipeline, feature engineering, modeling and evaluation.
04
System architecture
Stage 1:Data
5 tickers · 5 years
Adjusted daily prices and volume via yfinance
Stage 2:Features
15 indicators
Moving averages, RSI, MACD, volatility, lagged returns
Stage 3:Split
Temporal split
Train 2020–2023 · test 2024, no shuffling
Stage 4:Models
MA7 baseline
7-day moving average
ARIMA
Order chosen by auto-ARIMA
LSTM
2 stacked layers, 126,050 parameters, dual heads
Stage 5:Evaluate
MAPE
Price error
Directional accuracy
Up / down, per stock and on average
05
Technical implementation
A zero-leakage pipeline
Every feature uses only information available at prediction time, and the split is strictly by date — the models never train on the period they are tested on.
A dual-head LSTM
A 20-day window of 15 features feeds LSTM layers of 128 and 64 units and a 32-unit dense layer, then two heads: one regresses the next-day return, one classifies its direction. Trained with early stopping on a Kaggle T4 GPU in 3.4 seconds.
Baselines that are hard to beat
A 7-day moving average and auto-ARIMA give the LSTM something real to beat. Auto-ARIMA selected order (0,0,0) on Tesla — the signature of a random walk in daily returns.
06
Engineering decisions & challenges
Report both metrics
MAPE and directional accuracy tell different stories. Publishing only one would have crowned a different winner.
Per-stock evaluation
Averages hide volatility. Tesla's daily volatility (4.2%) is more than twice that of the other stocks, and it is the hardest to forecast.
07
Evaluation & results
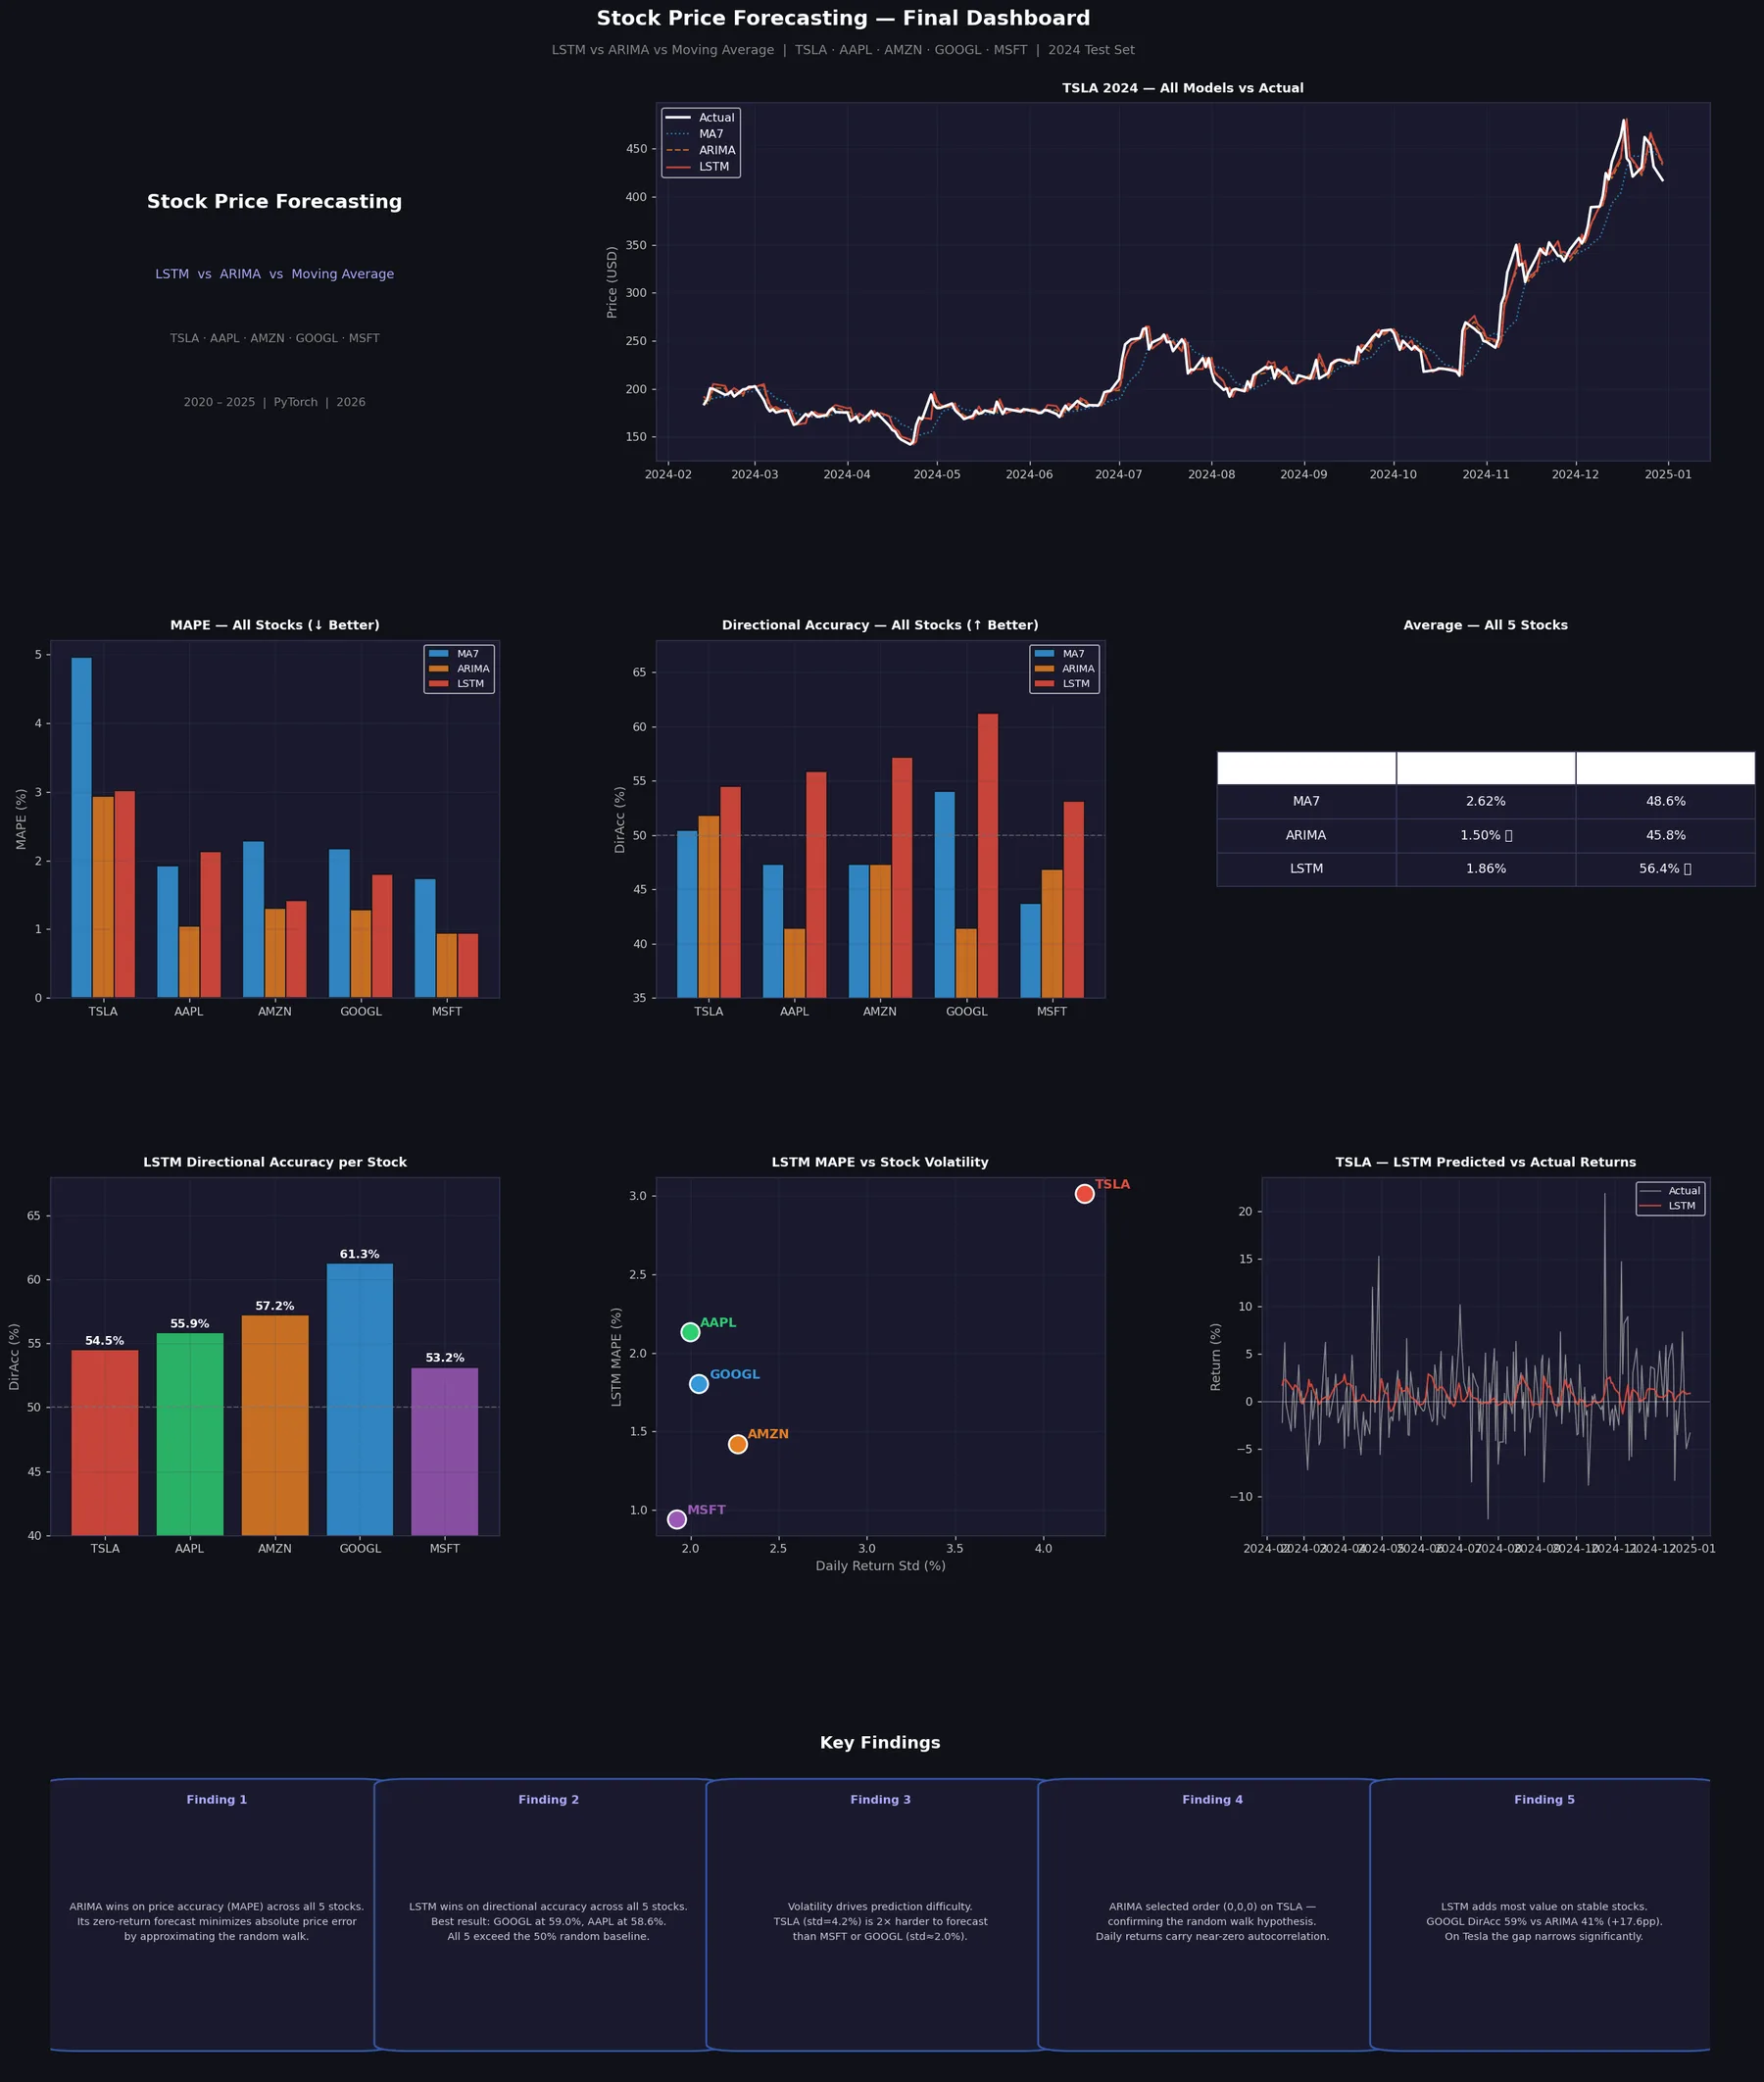
Averages across the five stocks on the 2024 test period, from the repository README.
- LSTM directional accuracy+5.5 points over a coin flip
- 55.5%
- ARIMA MAPELowest price error
- 1.50%
- LSTM MAPESecond on price error
- 1.90%
The metric picks the winner
ARIMA has the lowest price error; the LSTM is the only model that beats a coin flip on direction. Averages across five stocks, 2024 test period.
- LSTM1.90%
- ARIMA1.50%
- MA7 baseline2.62%
Show data tableHide data table
| Item | Value |
|---|---|
| LSTM | 1.90% |
| ARIMA | 1.50% |
| MA7 baseline | 2.62% |
- LSTM55.5%
- ARIMA45.8%
- MA7 baseline48.6%
Reference line: Coin flip at 50.
Show data tableHide data table
| Item | Value |
|---|---|
| LSTM | 55.5% |
| ARIMA | 45.8% |
| MA7 baseline | 48.6% |
Source: Repository README results table
- Educational project — not financial advice.
- Honest evaluation produces modest but trustworthy numbers: the LSTM's directional edge is real across stocks, but small.
08
From the notebook
Real figures from the project's notebook, as published in the repository. Select one to enlarge it.
09
Lessons learned
The metric determines the winner
Decide what question the model must answer before comparing models.
Leakage is the biggest risk
A strict temporal split costs impressive-looking numbers and buys trustworthy ones.
10
Technologies used
- Python
- PyTorch
- statsmodels
- pandas
- NumPy
- yfinance
Want the deeper walkthrough?
I'm happy to go through the code, the trade-offs and what I'd do next.